Welcome! This guide unlocks the power of your Vax steam cleaner, offering effective and eco-friendly cleaning. Discover versatile solutions for floors, carpets, and beyond!
Understanding the Benefits of Steam Cleaning
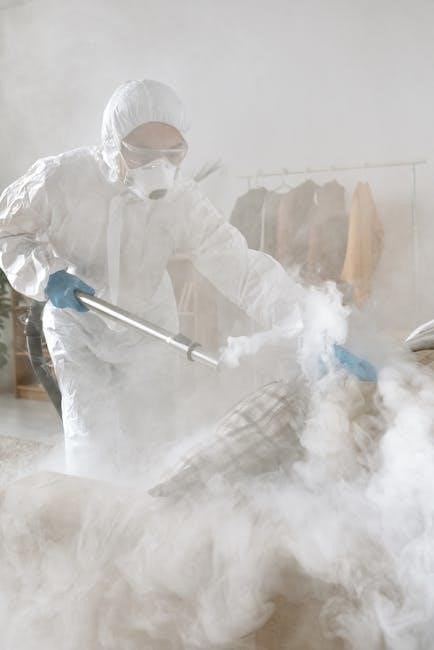
Steam cleaning offers a powerful, chemical-free way to sanitize and refresh your home. Harnessing the natural cleaning power of steam, Vax steam cleaners effectively eliminate dirt, grime, and up to 99.9% of bacteria. This method is ideal for allergy sufferers and families with pets, promoting a healthier living environment.
Beyond sanitation, steam cleaning revitalizes surfaces, leaving them looking fresh and new without harsh residues.
Vax Steam Cleaner Models: A Quick Overview
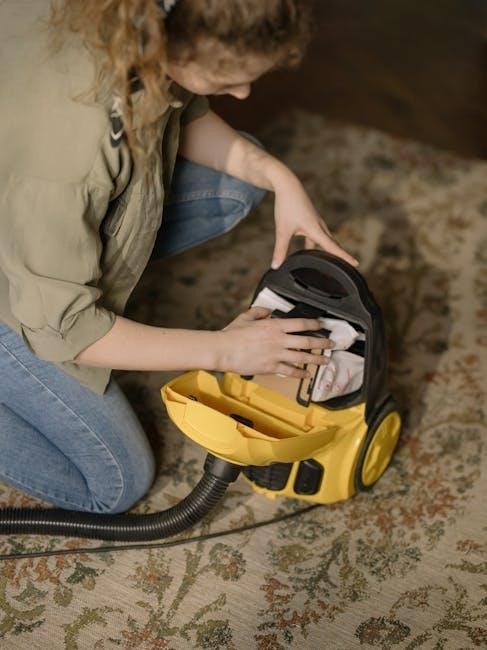
Vax offers a diverse range of steam cleaners, from lightweight handheld models for quick spot cleaning to robust multi-purpose machines for whole-home sanitation. Popular options include the S85-CM Steam Clean, known for its versatility, and various carpet cleaners with integrated steam functions.
Features vary by model, including variable steam control and specialized attachments for different surfaces.
Unboxing and Initial Setup
Carefully unpack your Vax steam cleaner, verifying all components are present. Prepare for assembly by reviewing the included parts list and diagrams.
Identifying the Components
Your Vax steam cleaner package includes the main unit, a water tank (often removable), various attachments like floor heads, handheld steamers, nozzles, and brushes. Locate the power cord, instruction manual, and potentially a detergent dispenser (model-specific). Familiarize yourself with each part – noting their shape and function – before proceeding with assembly. Refer to the diagrams in your user guide for clear visual identification of every component.
Assembling Your Vax Steam Cleaner
Begin by securely attaching the handle to the main unit, ensuring it clicks firmly into place. Next, connect the chosen attachment – floor head or handheld steamer – to the designated port. Verify a snug fit to prevent steam leakage during operation. If applicable, insert the detergent dispenser. Double-check all connections before filling the water tank, ensuring stability for safe and effective cleaning.
Filling the Water Tank
Ensure the steam cleaner is switched off and unplugged before filling. Locate the water tank and remove it carefully. Fill with distilled or filtered water to the ‘max’ line, avoiding overfilling. Using tap water can lead to scale buildup, reducing efficiency. Replace the tank securely, ensuring a tight seal. Now your Vax is ready for powerful steam cleaning!
Operating Instructions
Begin by connecting the desired attachment. Power on, select your steam level, and enjoy effective cleaning. Always refer to surface-specific guidance!
Powering On and Off
To initiate cleaning, firmly plug the Vax steam cleaner into a grounded electrical outlet. Press the power button – a clear indicator light will illuminate. For shutdown, depress the same power button until the light extinguishes. Always ensure the unit is completely off before refilling the water tank or changing attachments. Disconnecting from the outlet provides an extra safety measure, preventing accidental activation during maintenance or storage.
Steam Level Selection
Vax steam cleaners often feature adjustable steam settings. Lower settings are ideal for delicate surfaces like sealed wood floors or upholstery, minimizing potential damage. Higher settings deliver intense steam for stubborn dirt on tile, grout, or carpets. Consult your model’s specific guide to understand the available levels and their recommended applications. Start with a lower setting and increase as needed for optimal cleaning power.
Using Different Attachments
Maximize your Vax steam cleaner’s versatility by utilizing its attachments! The floor head excels on hard surfaces, while the handheld steamer tackles smaller areas and upholstery. Detailing tools, like nozzles and brushes, are perfect for grout, corners, and tight spaces. Ensure a secure connection before use, and always refer to your model’s manual for specific attachment guidance and safety precautions.

Attachments and Their Uses
Unlock cleaning power! Vax attachments expand functionality – floor heads for large areas, handheld steamers for detail work, and specialized tools for targeted grime removal.
Floor Head Attachment
The floor head is your go-to for hard surfaces and carpets. Ensure the microfiber pad is securely attached for optimal cleaning and glide. Adjust steam levels based on your floor type – lower for delicate wood, higher for tile.
For carpets, a gentle back-and-forth motion effectively lifts dirt and sanitizes fibers. Regularly check and clean the pad to maintain peak performance and prevent re-depositing grime. This attachment transforms floor care!
Handheld Steamer Attachment
The handheld steamer offers targeted cleaning power! Perfect for grout, faucets, and smaller areas, it provides precision and convenience. Attach appropriate nozzles for focused steam delivery.
Use short bursts of steam to avoid saturation, especially on delicate surfaces. Always test in an inconspicuous area first. This versatile tool sanitizes and removes grime from hard-to-reach spots, making quick cleanups effortless.
Detailing Tools (Nozzles, Brushes)
Maximize your Vax’s cleaning potential with detailing tools! Nozzles concentrate steam for precise cleaning of grout lines and tight spaces. Brushes offer gentle scrubbing action, ideal for loosening dirt on surfaces like ovens or shower doors.
Select the appropriate tool based on the surface and soil level. Always test in a hidden area first to ensure compatibility and prevent damage. These attachments enhance sanitization and grime removal.
Cleaning Different Surfaces
Adapt your Vax! Steam cleans hard floors, carpets, and upholstery effectively. Adjust settings and attachments for optimal results on each unique surface.
Hard Floors (Tile, Wood, Laminate)
For tile and laminate, use the floor head attachment with a low-to-medium steam setting to avoid damage. On sealed wood floors, test in an inconspicuous area first! Employ a gentle sweeping motion, overlapping each pass. Avoid prolonged exposure to high heat, which could potentially warp or discolor wood. Regularly clean the floor head to prevent streaks and ensure optimal performance. Remember, less is often more when steam cleaning delicate surfaces.
Carpets and Rugs
For carpets and rugs, utilize the appropriate floor head attachment and select a medium-to-high steam setting for effective dirt removal. Work in slow, overlapping strokes, allowing the steam to penetrate the fibers. Avoid over-saturating the carpet, as this can lead to mildew. For delicate rugs, test a hidden area first. Regularly check and empty the water tank for continuous cleaning power.
Upholstery Cleaning
To clean upholstery, employ the handheld steamer attachment with a suitable fabric-safe nozzle or brush. Always test on an inconspicuous area first to ensure colorfastness. Use a low-to-medium steam setting to avoid damage. Maintain a consistent distance to prevent over-wetting. Allow the upholstery to air dry completely before use, ensuring proper ventilation for optimal results.
Maintenance and Care
Regular upkeep ensures peak performance! Descale frequently, clean attachments after each use, and store your Vax steam cleaner properly for longevity.
Descaling the Steam Cleaner
Descaling is crucial for maintaining optimal steam production and extending the life of your Vax steam cleaner. Mineral buildup from water can reduce efficiency. Follow these steps: use a descaling solution (Vax recommends their own, or diluted white vinegar). Run the solution through the steam cleaner according to the model’s instructions, then rinse thoroughly with clean water. Repeat if necessary, ensuring no descaling solution remains before use.
Cleaning the Attachments
Regular attachment cleaning ensures hygienic and effective steam cleaning. After each use, allow attachments to cool completely. Wipe down surfaces with a damp cloth, removing any residue. For stubborn grime, use a mild detergent. Check nozzles and brushes for blockages, clearing them with a small pin or wire. Ensure attachments are fully dry before reattaching to the main unit.
Storing Your Vax Steam Cleaner
Proper storage extends your Vax steam cleaner’s lifespan. Always ensure the unit is completely cool and dry before storing. Empty the water tank to prevent mildew. Securely wrap the power cord. Store in a cool, dry place, away from direct sunlight and extreme temperatures. Keep attachments together for easy access during the next cleaning session.
Troubleshooting Common Issues
Facing problems? This section provides solutions for heating, leaks, and clogged nozzles, ensuring your Vax steam cleaner operates at peak performance.
Steam Cleaner Not Heating Up
If your Vax isn’t heating, first ensure it’s correctly plugged into a working outlet. Check the power switch is fully engaged. A descaling cycle might be needed if mineral buildup prevents heating.
Verify the water tank is adequately filled – some models won’t heat with insufficient water. If issues persist, consult the Vax support website for model-specific guidance or contact their customer service team.
Water Leaks
Discovering leaks? First, confirm the water tank is securely fastened and properly sealed. Inspect the tank for cracks or damage. Ensure attachments are firmly connected; loose fittings are a common cause. A clogged nozzle can also increase pressure, leading to leaks. If the leak continues, immediately unplug the Vax and contact Vax support for assistance, potentially requiring a repair or replacement part.
Clogged Nozzles
Experiencing reduced steam flow? Clogged nozzles are a frequent issue. First, power off and unplug your Vax steam cleaner. Carefully detach the affected nozzle and inspect for mineral buildup or debris. Use a small pin or wire to gently clear any obstructions. For stubborn clogs, soak the nozzle in a descaling solution before rinsing thoroughly. Regular cleaning prevents future blockages!
Safety Precautions
Prioritize safety! Avoid burns by directing steam away from yourself and others. Ensure proper ventilation and electrical safety during operation.
Avoiding Burns and Scalds
Steam is incredibly hot! Always direct the steam away from yourself, children, and pets. Never touch the steam nozzle or hot surfaces during or immediately after use. Utilize attachments to create distance. Be cautious when cleaning downwards, as steam can run along surfaces. Allow surfaces to cool before touching. Wear appropriate footwear to protect your feet.
Electrical Safety
Prioritize safety! Always ensure the power cord is undamaged and avoid using extensions if possible. Never operate the steam cleaner with wet hands or near water sources. Before plugging in, verify the voltage matches your outlet. Unplug the device when not in use and during maintenance. Do not attempt to repair it yourself; seek professional help.
Proper Ventilation
Ensure adequate airflow! Steam cleaning releases moisture into the air, so maintain good ventilation by opening windows or using a fan. This prevents condensation buildup and ensures a comfortable cleaning environment. Avoid using the steam cleaner in enclosed, poorly ventilated spaces for extended periods. Proper ventilation is crucial for safe operation.
Advanced Features (Model Specific)
Explore enhanced cleaning! Some Vax models offer variable steam control and integrated detergent dispensers for customized, powerful cleaning experiences.
Variable Steam Control
Adjust steam output for optimal results! Variable steam control allows you to tailor cleaning power to different surfaces. Lower settings are ideal for delicate fabrics and sealed hard floors, preventing damage. Higher settings tackle stubborn grime on tiles and heavily soiled carpets. Experiment to find the perfect balance, ensuring effective cleaning without risking material integrity. This feature maximizes versatility and efficiency, providing a customized cleaning experience;
Integrated Detergent Dispenser
Boost cleaning power with the built-in dispenser! Certain Vax models feature an integrated detergent dispenser, allowing you to add specialized cleaning solutions directly into the steam flow. This enhances stain removal and sanitization, particularly on carpets and upholstery. Always use Vax-approved detergents to avoid damaging the machine or surfaces. Follow the manufacturer’s instructions for proper dilution and usage for optimal results.
Finding Replacement Parts
Keep your Vax running smoothly! Genuine parts are available through the official Vax website or authorized retailers, ensuring compatibility and performance.
Vax Website and Support
For direct assistance, the official Vax website is your primary resource. Here, you can register your appliance, download detailed manuals, and access a comprehensive FAQ section addressing common issues.
Need further help? Vax provides online chat support and a dedicated customer service phone line. Locate your model’s specific support page for tailored guidance and replacement part ordering.
Third-Party Retailers
Beyond the official Vax site, numerous retailers carry Vax steam cleaner parts and accessories. Platforms like eBay offer both new and used components, potentially providing cost-effective solutions for repairs or replacements.
However, exercise caution when purchasing from third parties. Verify seller ratings and ensure compatibility with your specific Vax model before completing your purchase to avoid issues.

Understanding Model and Serial Numbers
Locate these details on your Vax steam cleaner for accurate support, warranty claims, and to ensure you order the correct replacement parts.
Locating the Information
Finding your Vax steam cleaner’s model and serial number is straightforward. Typically, a sticker or plate is affixed to the rear of the unit, or underneath the water tank. This label clearly displays both identifiers. Record these numbers immediately after purchase, as they are crucial for accessing warranty services, obtaining specific support, and ensuring compatibility when ordering replacement components. Keep this information readily available!
Importance for Support and Warranty
Your Vax steam cleaner’s model and serial number are vital for efficient support and warranty claims. When contacting Vax customer service, having these details expedites the process. They verify your purchase date and model specifics. Warranty coverage relies on accurate identification; without it, claims may be delayed or denied. Protect your investment by keeping these numbers safe and accessible!
Steam Cleaner vs. Carpet Cleaner
Steam cleaners sanitize with heat, while carpet cleaners use water and detergents. Choose steaming for general cleaning and carpet cleaning for deep stain removal.
Key Differences and When to Use Each
Steam cleaners excel at sanitizing hard surfaces and refreshing carpets using only water, reducing chemical reliance. They’re ideal for quick cleans and allergy sufferers. Carpet cleaners, however, employ detergents and agitation for deep cleaning, tackling embedded dirt and stubborn stains. Use a carpet cleaner for heavily soiled areas or periodic deep cleans, and a steam cleaner for lighter, more frequent sanitization and surface refreshment.

Eco-Friendly Cleaning with Steam
Steam cleaning drastically reduces the need for harsh chemicals, promoting a healthier home environment and sustainable cleaning practices for you and the planet.
Reducing Chemical Usage
Vax steam cleaners offer a powerful alternative to traditional cleaning methods reliant on strong chemicals. Utilizing only water, the high-temperature steam effectively dissolves dirt, grime, and bacteria. This significantly minimizes your household’s exposure to potentially harmful substances, creating a safer environment for families and pets. Embrace a healthier, more eco-conscious approach to maintaining a spotless home, reducing your carbon footprint with each clean!
Sustainable Cleaning Practices
Extend your Vax steam cleaner’s lifespan through mindful maintenance and responsible usage. Regularly descaling prevents mineral buildup, ensuring optimal performance and reducing energy consumption. Choosing reusable microfiber pads over disposable options minimizes waste. By embracing these practices, you contribute to a circular economy, lessening environmental impact and promoting a truly sustainable cleaning routine for a healthier planet.